服务器监控温度
服务器温度监控实战:sensors+Node Exporter+Prometheus+Grafana打造硬件健康防护网
运维必备,五分钟预警高温风险
在服务器运维中,CPU温度监控是预防硬件故障的关键环节。高温运行不仅会缩短硬件寿命,更是服务器宕机的“头号杀手”。今天我们将介绍如何通过sensors+Node Exporter+Prometheus+Grafana构建一套完善的服务器温度监控方案,实现从数据采集到可视化告警的全流程覆盖。
一、为什么需要专项监控服务器温度?
传统监控方案大多聚焦于CPU使用率、内存和磁盘等基础指标,却常常忽略温度指标这个直接影响硬件健康的“沉默哨兵”:
- 预防性维护:持续高温运行将导致CPU降频、硬件老化加速,提前预警可避免灾难性故障
- 散热系统监控:异常温度曲线往往暗示散热系统(风扇、散热片)失效
- 能效优化:温度与功耗直接相关,是能效优化(降低PUE)的关键指标
- 合规要求:金融、医疗等行业对服务器运行环境有严格合规要求
二、整体技术方案架构
这套监控方案采用分层设计,每层职责明确:
传感器层 → 采集层 → 存储层 → 可视化层
- sensors:通过lm_sensors工具读取服务器温度传感器数据
- Node Exporter:通过textfile收集器采集sensors输出,暴露给Prometheus
- Prometheus:定时抓取并存储时间序列数据
- Grafana:数据可视化及告警通知
企业级资源监控的“黄金组合”——Prometheus + Grafana + Exporter,在复杂环境中实现精准的资源监控
三、详细实施步骤
步骤1:安装配置lm_sensors(数据采集层)
通过包管理器安装sensors工具:
sudo yum install lm-sensors -y
检测并加载硬件驱动:
sudo sensors-detect --auto
执行sensors命令测试输出,你会看到如下格式的温度数据:
- 注意可能每台服务器的输出都不一样,下面的采集脚本可能不一样
coretemp-isa-0000
Adapter: ISA adapter
Package id 0:  +45.0°C  (high = +87.0°C, crit = +105.0°C)
Core 0:        +42.0°C  (high = +87.0°C, crit = +105.0°C)
Core 1:        +44.0°C  (high = +87.0°C, crit = +105.0°C)
步骤2:创建Node Exporter的textfile采集脚本
Node Exporter默认不包含温度采集功能,需通过textfile收集器实现:
创建数据采集脚本 /opt/scripts/sensors_to_prometheus.sh:
#!/bin/bash

# 输出文件路径
OUTPUT_FILE="/var/lib/node_exporter/temperature.prom"

# 确保目录存在
mkdir -p "$(dirname "$OUTPUT_FILE")"

# 获取传感器数据
TEMP_JSON=$(sensors -j 2>/dev/null || echo "{}")

# 解析温度值(带默认值)
CPU0_PKG=$(echo "$TEMP_JSON" | jq -r '.["coretemp-isa-0000"]["Package id 0"].temp1_input // "0"')
CPU1_PKG=$(echo "$TEMP_JSON" | jq -r '.["coretemp-isa-0001"]["Package id 1"].temp1_input // "0"')
GPU_TEMP=$(echo "$TEMP_JSON" | jq -r '.["nouveau-pci-0300"].temp1.temp1_input // "0"')

# 创建Prometheus指标文件
cat > "$OUTPUT_FILE" <<PROM
# HELP node_temperature_celsius Current temperature in Celsius
# TYPE node_temperature_celsius gauge
node_temperature_celsius{chip="coretemp-isa-0000",sensor="cpu00",socket="0"} $CPU0_PKG
node_temperature_celsius{chip="coretemp-isa-0001",sensor="cpu01",socket="1"} $CPU1_PKG
node_temperature_celsius{chip="nouveau-pci-0300",sensor="gpu_core"} $GPU_TEMP

# 添加脚本执行时间监控
node_temperature_script_last_success $(date +%s)
node_temperature_script_duration_seconds 0
PROM

# 设置权限
chmod 644 "$OUTPUT_FILE"
exit 0
赋予执行权限:chmod +x /opt/scripts/sensors_to_prometheus.sh
步骤3:配置Node Exporter的textfile收集器
启动Node Exporter时启用 textfile目录:
[Service]
User=node_exporter
Group=node_exporter
Type=simple
ExecStart=/usr/bin/node_exporter \
  --collector.textfile.directory=/var/lib/node_exporter \
  --collector.cpu \
  --collector.meminfo \
  --collector.filesystem \
  --collector.diskstats \
  --collector.netdev \
  --collector.uname

# 可选:添加额外收集器
# --collector.loadavg \
# --collector.netstat \
# --collector.systemd

Restart=always
RestartSec=5

[Install]
WantedBy=multi-user.targe
配置cron定时任务(每 1 分钟采集一次):
* * * * * /etc/node_exporter/scripts/temp_monitor.sh
chmod +x /etc/node_exporter/scripts/temp_monitor.sh
访问 http://服务器IP:9100/metrics 验证是否出现 node_temperature_celsius 指标
步骤4:配置Prometheus抓取目标
在 prometheus.yml 中添加作业配置:
scrape_configs:
  - job_name: 'node_temperature'
    scrape_interval: 15s
    static_configs:
      - targets: ['192.168.1.10:9100']
    relabel_configs:
      - source_labels: [__address__]
        target_label: instance
        regex: '(.*):.*'
        replacement: '$1'
重启Prometheus后可在Status → Targets页面查看采集状态
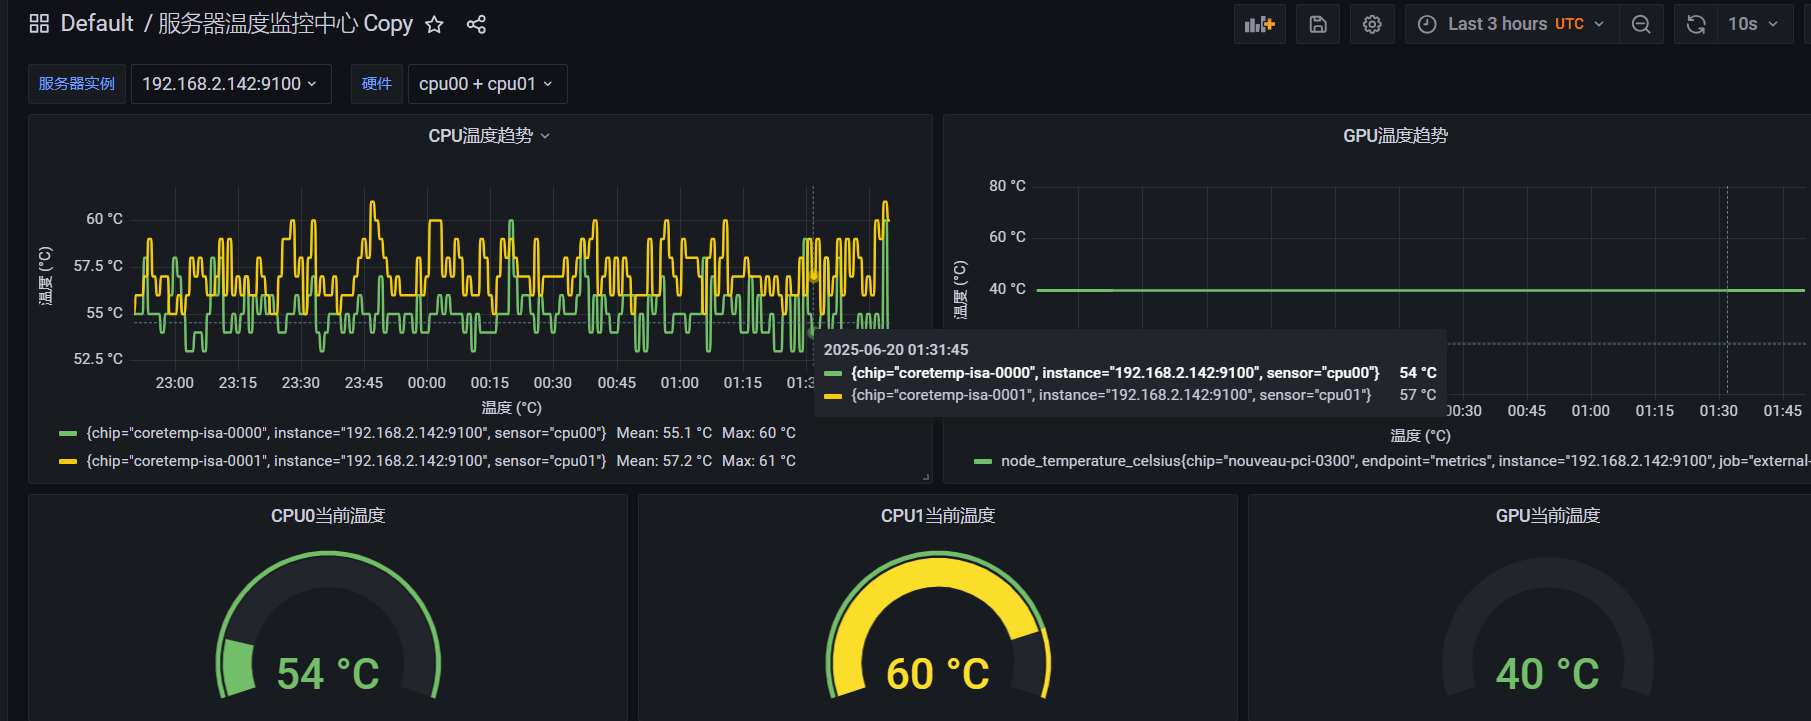
步骤5:Grafana可视化配置(重点!)
1. 添加Prometheus数据源
Configuration → Data Sources → Add data source → 填写Prometheus地址 http://prometheus-ip:9090
2. 导入专业温度监控仪表盘
推荐使用以下经过优化的模板:
{
"annotations": {
"list": [
{
"builtIn": 1,
"datasource": "prometheus",
"enable": true,
"hide": true,
"iconColor": "rgba(0, 211, 255, 1)",
"name": "Annotations & Alerts",
"target": {
"limit": 100,
"matchAny": false,
"tags": [],
"type": "dashboard"
},
"type": "dashboard"
}
]
},
"editable": true,
"fiscalYearStartMonth": 0,
"graphTooltip": 1,
"id": 29,
"iteration": 1750384174502,
"links": [],
"liveNow": true,
"panels": [
{
"datasource": {
"type": "prometheus",
"uid": "P1809F7CD0C75ACF3"
},
"fieldConfig": {
"defaults": {
"color": {
"mode": "palette-classic"
},
"custom": {
"axisLabel": "温度 (°C)",
"axisPlacement": "auto",
"barAlignment": 0,
"drawStyle": "line",
"fillOpacity": 0,
"gradientMode": "none",
"hideFrom": {
"legend": false,
"tooltip": false,
"viz": false
},
"lineInterpolation": "smooth",
"lineWidth": 2,
"pointSize": 5,
"scaleDistribution": {
"type": "linear"
},
"showPoints": "auto",
"spanNulls": false,
"stacking": {
"group": "A",
"mode": "none"
},
"thresholdsStyle": {
"mode": "off"
}
},
"mappings": [],
"thresholds": {
"mode": "absolute",
"steps": [
{
"color": "green",
"value": null
},
{
"color": "yellow",
"value": 60
},
{
"color": "red",
"value": 70
}
]
},
"unit": "celsius"
},
"overrides": []
},
"gridPos": {
"h": 8,
"w": 12,
"x": 0,
"y": 0
},
"id": 2,
"options": {
"legend": {
"calcs": [
"mean",
"max"
],
"displayMode": "list",
"placement": "bottom",
"showLegend": true
},
"tooltip": {
"mode": "multi"
}
},
"targets": [
{
"datasource": {
"type": "prometheus",
"uid": "P1809F7CD0C75ACF3"
},
"exemplar": true,
"expr": " max by (instance, chip, sensor) (\r\n label_replace(\r\n node_temperature_celsius{sensor=~\"$query0\"},\r\n \"temp_value\", \"${1}\", \"\", \"(.+)\"\r\n )\r\n ) \r\n",
"instant": false,
"interval": "",
"legendFormat": "",
"refId": "A"
}
],
"title": "CPU温度趋势",
"type": "timeseries"
},
{
"datasource": {
"type": "prometheus",
"uid": "P1809F7CD0C75ACF3"
},
"fieldConfig": {
"defaults": {
"color": {
"mode": "palette-classic"
},
"custom": {
"axisLabel": "温度 (°C)",
"axisPlacement": "auto",
"barAlignment": 0,
"drawStyle": "line",
"fillOpacity": 0,
"gradientMode": "none",
"hideFrom": {
"legend": false,
"tooltip": false,
"viz": false
},
"lineInterpolation": "smooth",
"lineWidth": 2,
"pointSize": 5,
"scaleDistribution": {
"type": "linear"
},
"showPoints": "auto",
"spanNulls": false,
"stacking": {
"group": "A",
"mode": "none"
},
"thresholdsStyle": {
"mode": "off"
}
},
"mappings": [],
"thresholds": {
"mode": "absolute",
"steps": [
{
"color": "green",
"value": null
},
{
"color": "yellow",
"value": 55
},
{
"color": "red",
"value": 65
}
]
},
"unit": "celsius"
},
"overrides": []
},
"gridPos": {
"h": 8,
"w": 12,
"x": 12,
"y": 0
},
"id": 3,
"options": {
"legend": {
"calcs": [
"mean",
"max"
],
"displayMode": "list",
"placement": "bottom",
"showLegend": true
},
"tooltip": {
"mode": "single"
}
},
"targets": [
{
"datasource": {
"type": "prometheus",
"uid": "P1809F7CD0C75ACF3"
},
"exemplar": true,
"expr": "node_temperature_celsius{sensor=\"gpu_core\"}",
"interval": "",
"legendFormat": "",
"refId": "A"
}
],
"title": "GPU温度趋势",
"type": "timeseries"
},
{
"datasource": {
"type": "prometheus",
"uid": "P1809F7CD0C75ACF3"
},
"fieldConfig": {
"defaults": {
"color": {
"mode": "thresholds"
},
"mappings": [],
"thresholds": {
"mode": "absolute",
"steps": [
{
"color": "green",
"value": null
},
{
"color": "yellow",
"value": 60
},
{
"color": "red",
"value": 70
}
]
},
"unit": "celsius"
},
"overrides": []
},
"gridPos": {
"h": 5,
"w": 8,
"x": 0,
"y": 8
},
"id": 4,
"options": {
"orientation": "auto",
"reduceOptions": {
"calcs": [
"lastNotNull"
],
"fields": "",
"values": false
},
"showThresholdLabels": false,
"showThresholdMarkers": true
},
"pluginVersion": "8.3.3",
"targets": [
{
"datasource": {
"type": "prometheus",
"uid": "P1809F7CD0C75ACF3"
},
"exemplar": true,
"expr": "node_temperature_celsius{sensor=\"cpu00\"}",
"interval": "",
"legendFormat": "",
"refId": "A"
}
],
"title": "CPU0当前温度",
"type": "gauge"
},
{
"datasource": {
"type": "prometheus",
"uid": "P1809F7CD0C75ACF3"
},
"fieldConfig": {
"defaults": {
"color": {
"mode": "thresholds"
},
"mappings": [],
"thresholds": {
"mode": "absolute",
"steps": [
{
"color": "green",
"value": null
},
{
"color": "yellow",
"value": 60
},
{
"color": "red",
"value": 70
}
]
},
"unit": "celsius"
},
"overrides": []
},
"gridPos": {
"h": 5,
"w": 8,
"x": 8,
"y": 8
},
"id": 5,
"options": {
"orientation": "auto",
"reduceOptions": {
"calcs": [
"lastNotNull"
],
"fields": "",
"values": false
},
"showThresholdLabels": false,
"showThresholdMarkers": true
},
"pluginVersion": "8.3.3",
"targets": [
{
"datasource": {
"type": "prometheus",
"uid": "P1809F7CD0C75ACF3"
},
"exemplar": true,
"expr": "node_temperature_celsius{sensor=\"cpu01\"}",
"interval": "",
"legendFormat": "",
"refId": "A"
}
],
"title": "CPU1当前温度",
"type": "gauge"
},
{
"datasource": {
"type": "prometheus",
"uid": "P1809F7CD0C75ACF3"
},
"fieldConfig": {
"defaults": {
"color": {
"mode": "thresholds"
},
"mappings": [],
"thresholds": {
"mode": "absolute",
"steps": [
{
"color": "green",
"value": null
},
{
"color": "yellow",
"value": 55
},
{
"color": "red",
"value": 65
}
]
},
"unit": "celsius"
},
"overrides": []
},
"gridPos": {
"h": 5,
"w": 8,
"x": 16,
"y": 8
},
"id": 6,
"options": {
"orientation": "auto",
"reduceOptions": {
"calcs": [
"lastNotNull"
],
"fields": "",
"values": false
},
"showThresholdLabels": false,
"showThresholdMarkers": true
},
"pluginVersion": "8.3.3",
"targets": [
{
"datasource": {
"type": "prometheus",
"uid": "P1809F7CD0C75ACF3"
},
"exemplar": true,
"expr": "node_temperature_celsius{sensor=\"gpu_core\"}",
"interval": "",
"legendFormat": "",
"refId": "A"
}
],
"title": "GPU当前温度",
"type": "gauge"
},
{
"datasource": {
"type": "prometheus",
"uid": "P1809F7CD0C75ACF3"
},
"fieldConfig": {
"defaults": {
"custom": {
"align": "auto",
"displayMode": "auto"
},
"mappings": [],
"thresholds": {
"mode": "absolute",
"steps": [
{
"color": "green",
"value": null
},
{
"color": "red",
"value": 80
}
]
}
},
"overrides": [
{
"matcher": {
"id": "byName",
"options": "Value"
},
"properties": [
{
"id": "displayName",
"value": "温度值 (°C)"
},
{
"id": "unit",
"value": "celsius"
}
]
}
]
},
"gridPos": {
"h": 8,
"w": 24,
"x": 0,
"y": 13
},
"id": 7,
"options": {
"footer": {
"fields": "",
"reducer": [
"sum"
],
"show": false
},
"frameIndex": 0,
"rowHeight": "sm",
"showHeader": true
},
"pluginVersion": "8.3.3",
"targets": [
{
"datasource": {
"type": "prometheus",
"uid": "P1809F7CD0C75ACF3"
},
"refId": "A"
}
],
"title": "温度数据详情",
"type": "table"
}
],
"refresh": "10s",
"schemaVersion": 34,
"style": "dark",
"tags": [],
"templating": {
"list": [
{
"current": {
"selected": false,
"text": "192.168.2.142:9100",
"value": "192.168.2.142:9100"
},
"datasource": {
"type": "prometheus",
"uid": "P1809F7CD0C75ACF3"
},
"definition": "label_values(node_temperature_celsius, instance)",
"hide": 0,
"includeAll": false,
"label": "服务器实例",
"multi": false,
"name": "instance",
"options": [],
"query": {
"query": "label_values(node_temperature_celsius, instance)",
"refId": "StandardVariableQuery"
},
"refresh": 1,
"regex": "",
"skipUrlSync": false,
"sort": 1,
"type": "query"
},
{
"current": {
"selected": true,
"text": [
"cpu00",
"cpu01"
],
"value": [
"cpu00",
"cpu01"
]
},
"datasource": {
"type": "prometheus",
"uid": "P1809F7CD0C75ACF3"
},
"definition": "label_values(node_temperature_celsius, sensor)",
"hide": 0,
"includeAll": true,
"label": "硬件",
"multi": true,
"name": "query0",
"options": [],
"query": {
"query": "label_values(node_temperature_celsius, sensor)",
"refId": "StandardVariableQuery"
},
"refresh": 1,
"regex": "",
"skipUrlSync": false,
"sort": 0,
"type": "query"
}
]
},
"time": {
"from": "now-3h",
"to": "now"
},
"timepicker": {
"refresh_intervals": [
"5s",
"10s",
"30s",
"1m",
"5m",
"15m",
"30m",
"1h"
]
},
"timezone": "",
"title": "服务器温度监控中心 Copy",
"uid": "RlXfrWEHk",
"version": 3,
"weekStart": ""
}

步骤6:配置温度告警规则
在Grafana中设置智能告警:
# 高温告警规则
sum by (instance) (
  node_sensors_temperature > 90
)
配置告警通道:
- 进入Alerting → Notification channels
- 添加邮件/钉钉/企业微信等通知方式
- 设置多级通知策略:
- 75°C:警告级别(工作群通知)
- 85°C:严重级别(电话通知运维负责人)
- 95°C:灾难级别(自动触发故障转移)